Stops & Icebergs On-Chart Indicator
What Is the Stops & Iceberg On-Chart Indicator?
This add-on tracks the evolution of iceberg orders and the execution of stop orders. It shows precisely when and at what price icebergs are detected, traded, fully executed or canceled, and also shows executed stop orders trades on the main Bookmap chart.
This is an additional indicator that can be loaded separately, or with the Stops & Icebergs Sub-Chart Indicator. The key difference is how and where the additional information is displayed, in keeping with the names “On-chart” and “Sub-chart”.
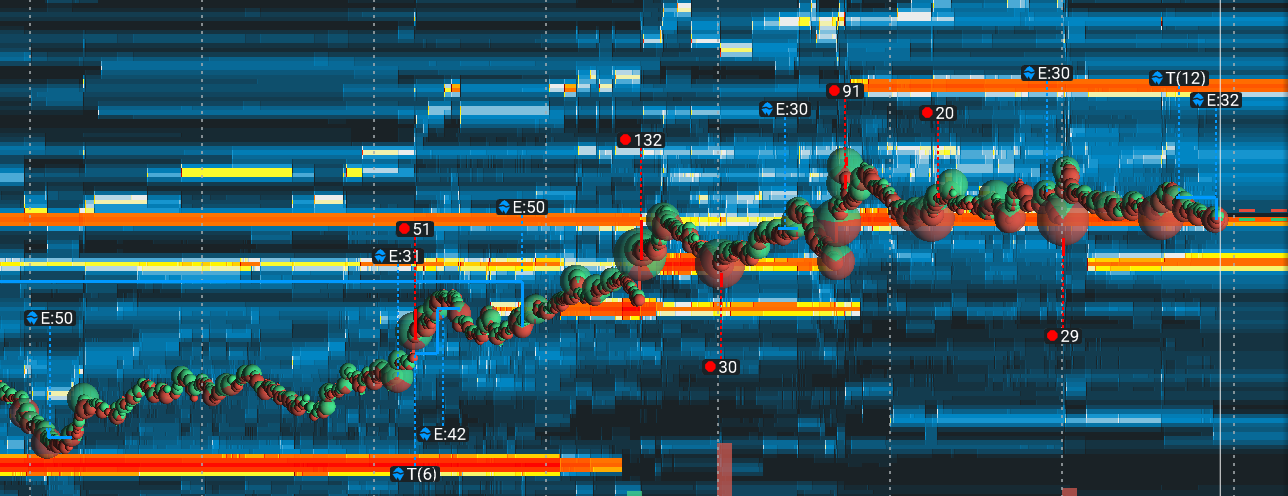
Key Features:
- Accurate detection and tracking of iceberg orders and stop orders
- Display of icebergs that are partially executed and still live
- Filters stops and icebergs by traded size
- Instant computation and display of each update as it happens in real-time
You can watch this video to learn more - including installation, configuration, and usage.
The Stops & Iceberg On-Chart add-on only works with CME MBO (Rithmic & Bookmap Data) real-time data (in non-aggregated mode). The add-on is part of the MBO Bundle.
Understanding Iceberg Orders
Iceberg orders are buy or sell limit orders that have been split into smaller limit orders to hide the total order quantity. The term "iceberg" comes from the fact that the visible lots are just the "tip of the iceberg", given the greater number of limit orders are not visible.
Icebergs Visual Appearance
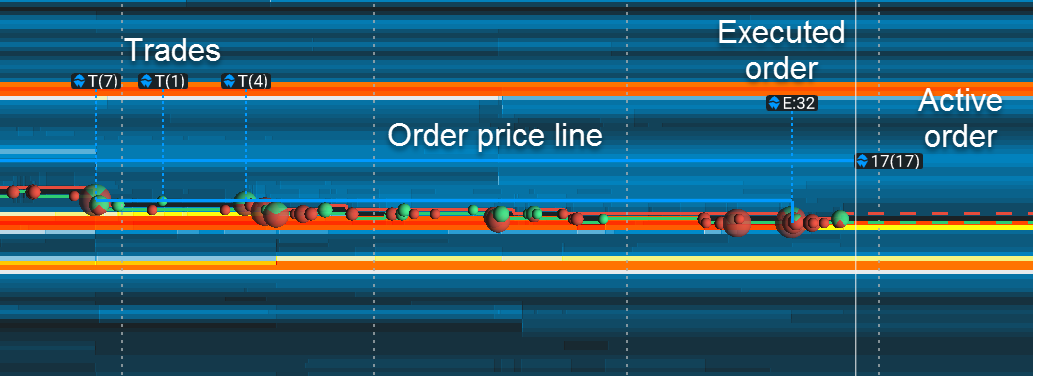
Icons on the chart that are connected to trade dots indicate the price area where this volume was traded. The direction of the icons shows the order type: up for sell icebergs and down for buy icebergs.
The letter represents the type of the event:
D - Detection: an iceberg was detected.
T - Trade: a trade was executed against one of the icebergs.
E - Execution: an iceberg was fully executed.
C - Cancellation: an iceberg was canceled.
The number represents the volume. The number in brackets is the traded volume for that specific event, while a number without brackets is the total traded volume for an iceberg.
It is important to note that the volume number on the Cancellation event shows the total traded size for the iceberg before it was canceled, not the remaining iceberg part, which is unknown.
The icon on the right side of the timeline (“17(17)” in the above image) indicates that an Iceberg order is still active, and the position of it shows its current price. The number near the active order icon shows the total executed order volume when without brackets, and the last trade volume when in brackets.
With both icons, you will see a thick horizontal line, marking a price on the chart where the order was active. If this line changes its orientation to vertical in some places, it means that the iceberg order was moved to another price level where the line indicates. All event icons are pinned to that line with thin vertical dotted lines.
Stops Visual Appearance
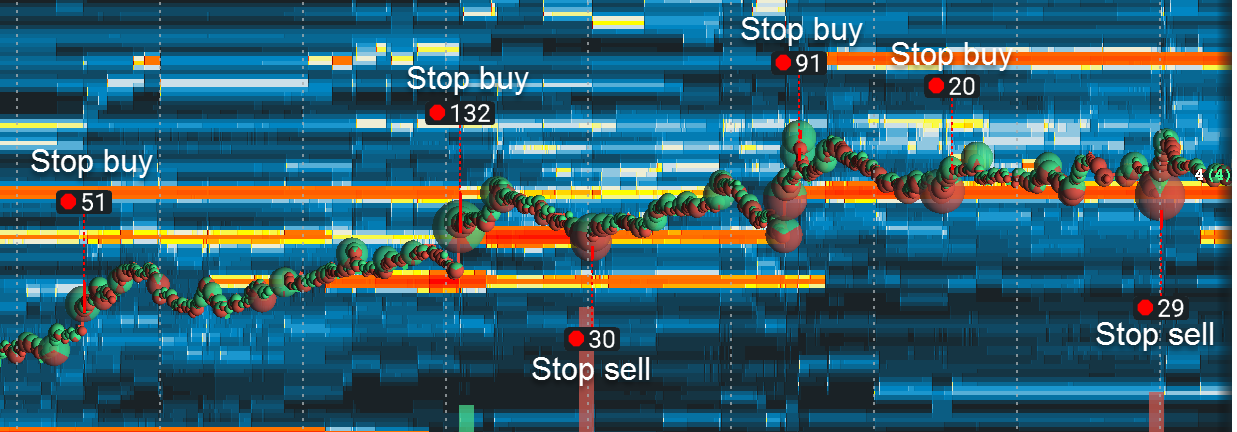
A stops chain is highlighted with a bold vertical line that shows the price area of the stop run, with an icon pinned to it via the connected dotted line. This icon shows the total volume of trades within that chain.
The direction of the icon shows the type of chain: up for buy stops and down for sell stops. The offset direction is inverted as compared to icebergs because an iceberg is usually (but not always) on the passive side of a trade, while stop trades are always aggressive.
Unlike icebergs, where each iceberg order is shown separately, a stops chain may include trades from several different stop orders triggered within the same stop run.
Settings
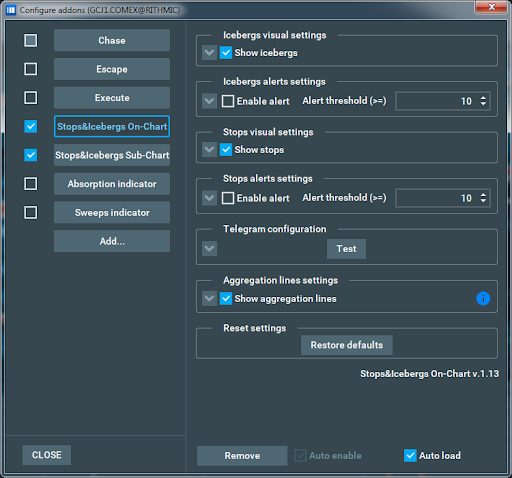
The add-on has separate settings for both stops detection and icebergs detection allowing you to fully customize your on-chart heatmap. You can show/hide specific orders type by clicking the “Show stops/icebergs” checkbox.
Click 🆅 to access the detailed settings of any panel.
Stops/Icebergs alerts settings panel contains the settings for corresponding alerts. This allows you to customize the alert threshold for both Stops/Icebergs separately, as well as enable/disable them. Once the configured threshold is reached, Bookmap will send you an alert.
The Telegram configuration panel is used for configuring your Telegram notifications, allowing you to have your alerts and notifications sent directly to you via Telegram. This means you can always stay informed of key market events, even when away from Bookmap.
The Aggregation lines settings panel allows you to configure aggregation lines.
The Restore defaults button resets all settings to default.
Under the settings panels, you can find the name and version of the add-on.
Icebergs Threshold Settings
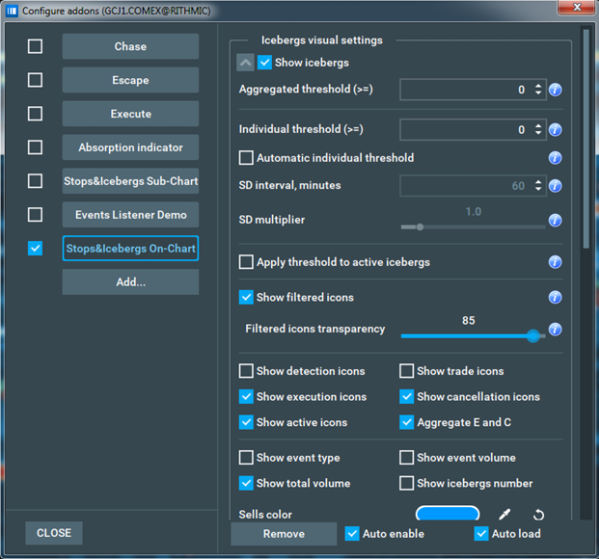
The individual size threshold determines which size the total order traded size will be filtered out at. Only orders where the total traded size is more or equal to the selected value will be indicated on the screen.
Note that only already traded volume is taken into account - the total order size for the iceberg could be much bigger. With this option, you can filter out smaller orders.
If several icons are drawn close to each other they may be merged into one single icon to prevent them from overlapping and becoming difficult to read. This process is called aggregation.
The aggregated threshold is only applied to the icons of orders that have successfully passed the individual threshold. Only icons with traded size more or equal to the selected value will be displayed on the screen.
Here is an example of how threshold filters work for better understanding:
- Let's assume there are 3 icebergs in one place (so all the icons will be aggregated) with volumes of 5, 10 and 20.
- The Individual filter is set to 8, so the iceberg with a volume of 5 will be filtered out.
- Icebergs with volumes of 10 and 20 are aggregated into one 30 icon.
- The Aggregated filter is set to 15, so the icon 30 will not be filtered out.
- If you zoom in the icon area with the same parameters, the aggregated icon will split to 10 and 20, meaning the aggregation filter will kick in and the 10 volume will be filtered out. The filtered-out icons will not completely disappear, but instead be semi-transparent. The transparency level can be configured.
The automatic size threshold checkbox enables the automatic calculation and updating of the individual size threshold. When automatic mode is on, the individual size threshold is recalculated once per minute, and on every threshold settings change.
This automated size threshold value is calculated with a fine-tuned equation:
In this equation:
-
SD is standard deviation.
-
SD interval means the interval (in minutes) between the current moment and the time of the chosen icebergs for SD calculation. Only visible total executed volumes on the interval without active orders are included in the calculation. If you hide some execution or cancellation icons, that will affect the threshold calculation. In other words, the threshold is calculated only on events with total volume that is visible on the chart.
-
SD multiplier is the multiplier used for calculation in the formula above
-
Average is the average iceberg size on the SD interval.
What does this mean? In short, in automated mode where the SD multiplier = 0, you will see icebergs of average size and above. If you increase the SD multiplier the size threshold grows, and so only bigger icebergs stay on-screen while smaller ones are filtered out.
There is also one more restriction - automatic mode will not set a size threshold bigger than the biggest iceberg in the SD interval. This guarantees that in automatic mode you will always see at least the one biggest iceberg within the SD interval on the screen, regardless of any other filtering settings.
The Apply threshold to the active icebergs allows you to hide/show small, partially executed icebergs that are still in the orderbook.
Icebergs Visual Settings
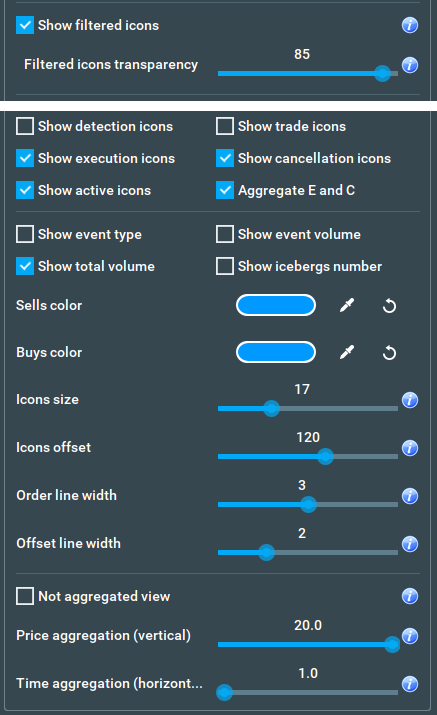
Show filtered icons checkbox: enables the showing of semi-transparent icons on the chart, despite being filtered out by the size filters. Their semi-transparency indicates that they have been filtered out.
Filtered icons transparency slider: allows you to choose the transparency level for the above filtered-out icons.
Show icons checkboxes: allow you to turn on/off specific icons i.e. execution icons.
Aggregate E and С checkbox: tells the indicator to calculate the total volume for E and C events together in the case when E and C event icons are aggregated. If it is unchecked, you will see two separate total traded volumes for E and C events accordingly.
Icons text settings checkboxes allow you to control the text near the icon:
Show event type: shows each event type letter beside its icon.
Show event volume: shows the individual event volume (as a number in brackets) for Detection and Trade events. Detection has some volume, too, because we can only detect that the order is an Iceberg after the trade. Hence, detection volume includes the volume of all trades on that iceberg before it was detected.
Show total volume: shows the total traded volume (as a number without brackets) for icebergs that are totally Executed, Canceled, or still Active.
Show icebergs number checkbox: shows the number of icebergs, events from which were aggregated, near each aggregated icon.
Sells and buys color are the colors of all corresponding iceberg orders lines and icons.
Icons size is the size of all iceberg icons.
Icons offset determines the distance of all icons from the BBO.
Order line width determines the width of the order price line.
Offset line width determines the width of the dashed vertical lines that connect event icons with their order price line.
Not aggregated view checkbox: disables the aggregation of icons, so you can see exactly where each event happened. However, this may lead to icons overlapping along with performance issues due to the large number of icons, so using this mode with large amounts of data is absolutely not recommended.
Price aggregation (vertical) and Time aggregation (horizontal) set the size of the (invisible) rectangular area surrounding each iceberg icon, where all other iceberg icons inside the area will be aggregated into one. The numbers here are essentially multipliers for the icon width and height, correspondingly.
If you set, for example, price aggregation = 2 and time aggregation = 4, the resulting aggregation area would be a rectangle with sizes 2x (icon height) and 4x (icon width), with the center being in the middle of the initial icon. If both parameters are set to 1, the aggregation area completely matches the icon size, so only overlapping icons would be aggregated.
We use a volume-weighted algorithm for the positioning of aggregated icons. Therefore, if several icons were aggregated into one, the resulting icon would be somewhere in the middle (positionally) between all the initial icons. Its volume would be the sum of volume of all the initial icons. If the “Not Aggregated” view mode is on, the price and time aggregation sliders are automatically disabled, and their values have no effect.
Icebergs Alerts Settings
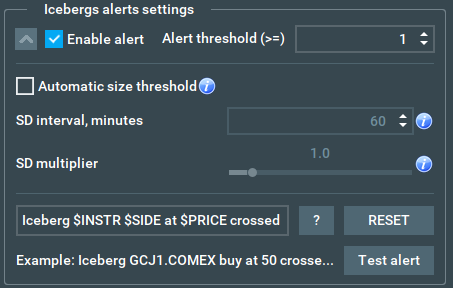
The Enable alert checkbox enables both voice and text alerts for when the active iceberg traded size crosses the filtering threshold for the first time.
The Automatic size threshold here works the same way as for icebergs and is synchronized with it. If you use the same threshold settings for icebergs and icebergs alerts, you will get an alert for each new iceberg you see on the chart, with the Automatic size threshold constantly analyzing past intervals and updating both its own and the alerts threshold over time.
The Alert template text field below allows you to set the text template for alerts from a number of templates.
The ? button shows a list of available templates you can choose from:
- $INSTRUMENT - full instrument name
- $INSTR - instrument name without @exchange part
- $SIDE - buy or sell
- $PRICE - the current price of an iceberg or volume weighted price for a stops chain
- $VOLUME - the current traded volume of an iceberg, or total traded volume for a stops chain
- $THRESHOLD - current volume threshold
The Reset button resets the alert template to default. Meanwhile, the Example field shows you an example alert text for their current alert template so you can determine which exact alert you want. The Test alert button plays your alert using text from the example field.
Stops Settings
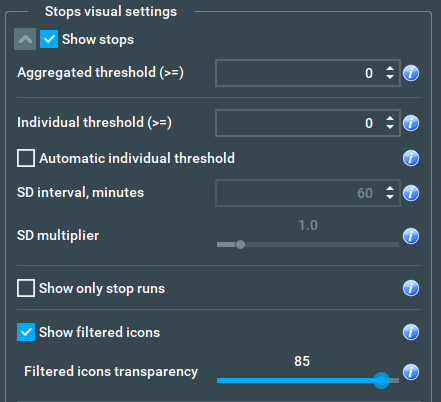
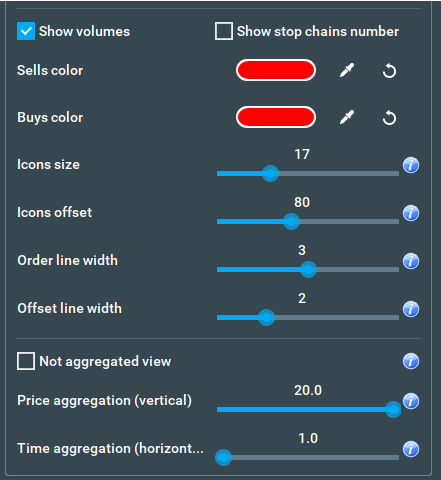
Stops settings are similar to icebergs settings, except that stops settings have fewer options. This is because for stops we have only one event type - the stop trade.
The size threshold for stops works in a similar fashion to the iceberg’s size threshold, except it considers the size of the whole triggered stops chain, which may include more than one stop order.
There is also one new option: Show only stop runs. When this is enabled you will see only the stop chains that were executed on more than one price level on the chart.
Telegram Notifications Guide For Stops & Icebergs On-Chart
To start getting Telegram notifications from your Stops & Icebergs On-Chart, you need to implement the following steps:
1. Getting Started
Install the Telegram Desktop application https://desktop.telegram.org/ and create an account.
You can also use either web or mobile versions of Telegram, but we recommend using the desktop version for a better user experience during the configuration process - this can then be linked to and used on the mobile version once configured.
2. Create a Telegram bot
Open the following link in your Telegram application: https://t.me/BotFather, and then follow these instructions.
-
Send “/start” message to start working with the bots management bot.
-
Send “/newbot” message to create a new bot.
-
Choose a name for your bot by sending it as a new message.
-
Choose a username for your bot by sending it as a new message. Username should be unique and must end in “bot”.
-
When your bot is successfully created, you will get a message with an access token for this bot. Copy this access token to the SI On-Chart -> Telegram Configuration -> Token
3. Obtain the Chat ID where you want to get notifications
-
Enter the Telegram account for which you want to get notifications.
-
Open the following link inside of Telegram: https://t.me/get_id_bot.
-
Send “/start” message to start working with the bot.
-
Receive your chat ID via the bot's response.
-
Copy this chat ID into SI On-Chart -> Telegram Configuration -> Chat ID
4. Start a conversation with your bot
Open the link https://t.me/your-bot?start=subscribe inside of Telegram. In this link “your-bot” is a placeholder for the username of your bot - make sure you change accordingly! Next, Send “/start” message to start a conversation with your bot.
5. Run A Test
Click the “Test” button on the Telegram configuration panel inside Bookmap to make sure that everything is configured properly. You should receive a test notification message in Telegram from your bot if everything is OK, or an error message describing the problem otherwise.
6. Enable Telegram notifications
Finally, you must enable Telegram notifications by checking the “Enable Telegram alerts” checkbox on icebergs or stops alerts settings panel, or both.
Synthetic instruments (TM.Pro, TM.Lite, Copy)
While the SI On-Chart add-on cannot run on synthetic instruments (instruments created by Instrument Copy, Tradermap Pro and Tradermap Lite add-ons) you still can get the detections there.
To achieve this, simply enable the add-on for the original instrument, and it will project its detections to all synthetic instruments with appropriate names. In this case, “appropriate" means that the copy name should start with the original instrument name.
For example: ESU4.CME@RITHMIC -> ESU4.CME-123@TM.Pro
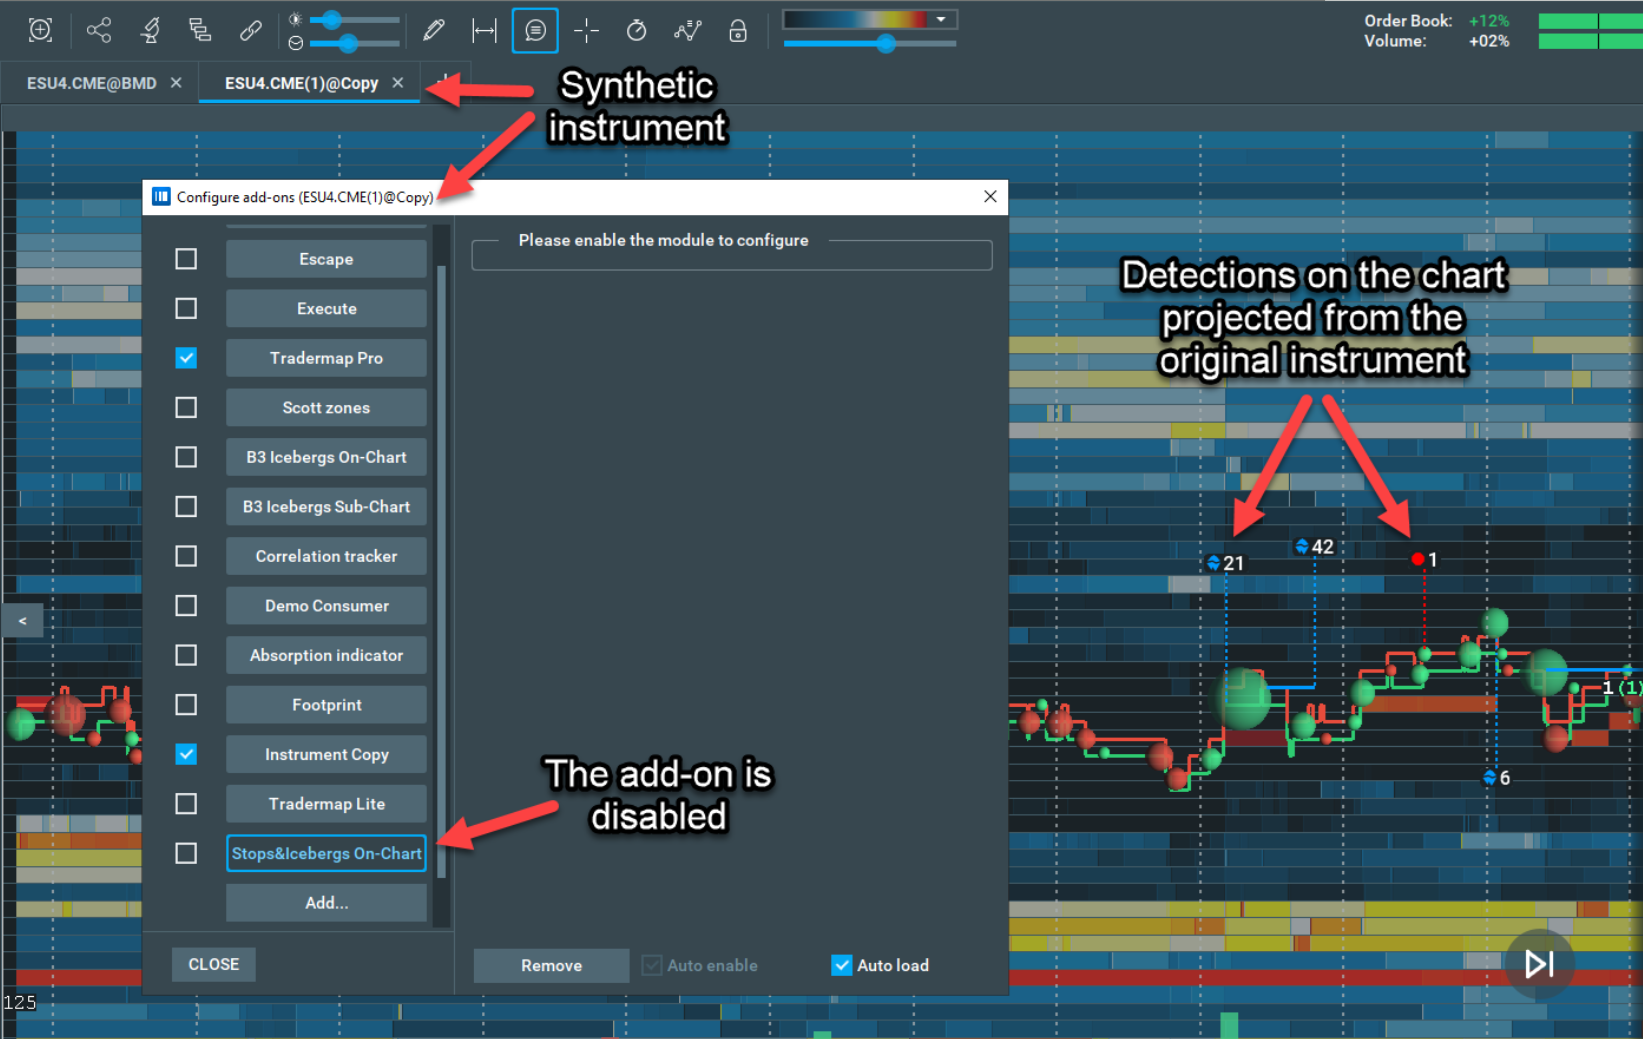
If you want a synthetic instrument without SI On-Chart detections you have 2 options:
- Disable the add-on for the original instrument
- Give the synthetic instrument a name that does not fit the original instrument name. Example: ESU4.CME@RITHMIC -> ES@TM.Pro (not applicable for the Instrument Copy add-on)
Important Notes
Rithmic Data
- The add-on works with CME MBO (Market by Order) data provided by Rithmic and Bookmap Data. See the screenshots below to see how you should configure your Rithmic connectivity settings:
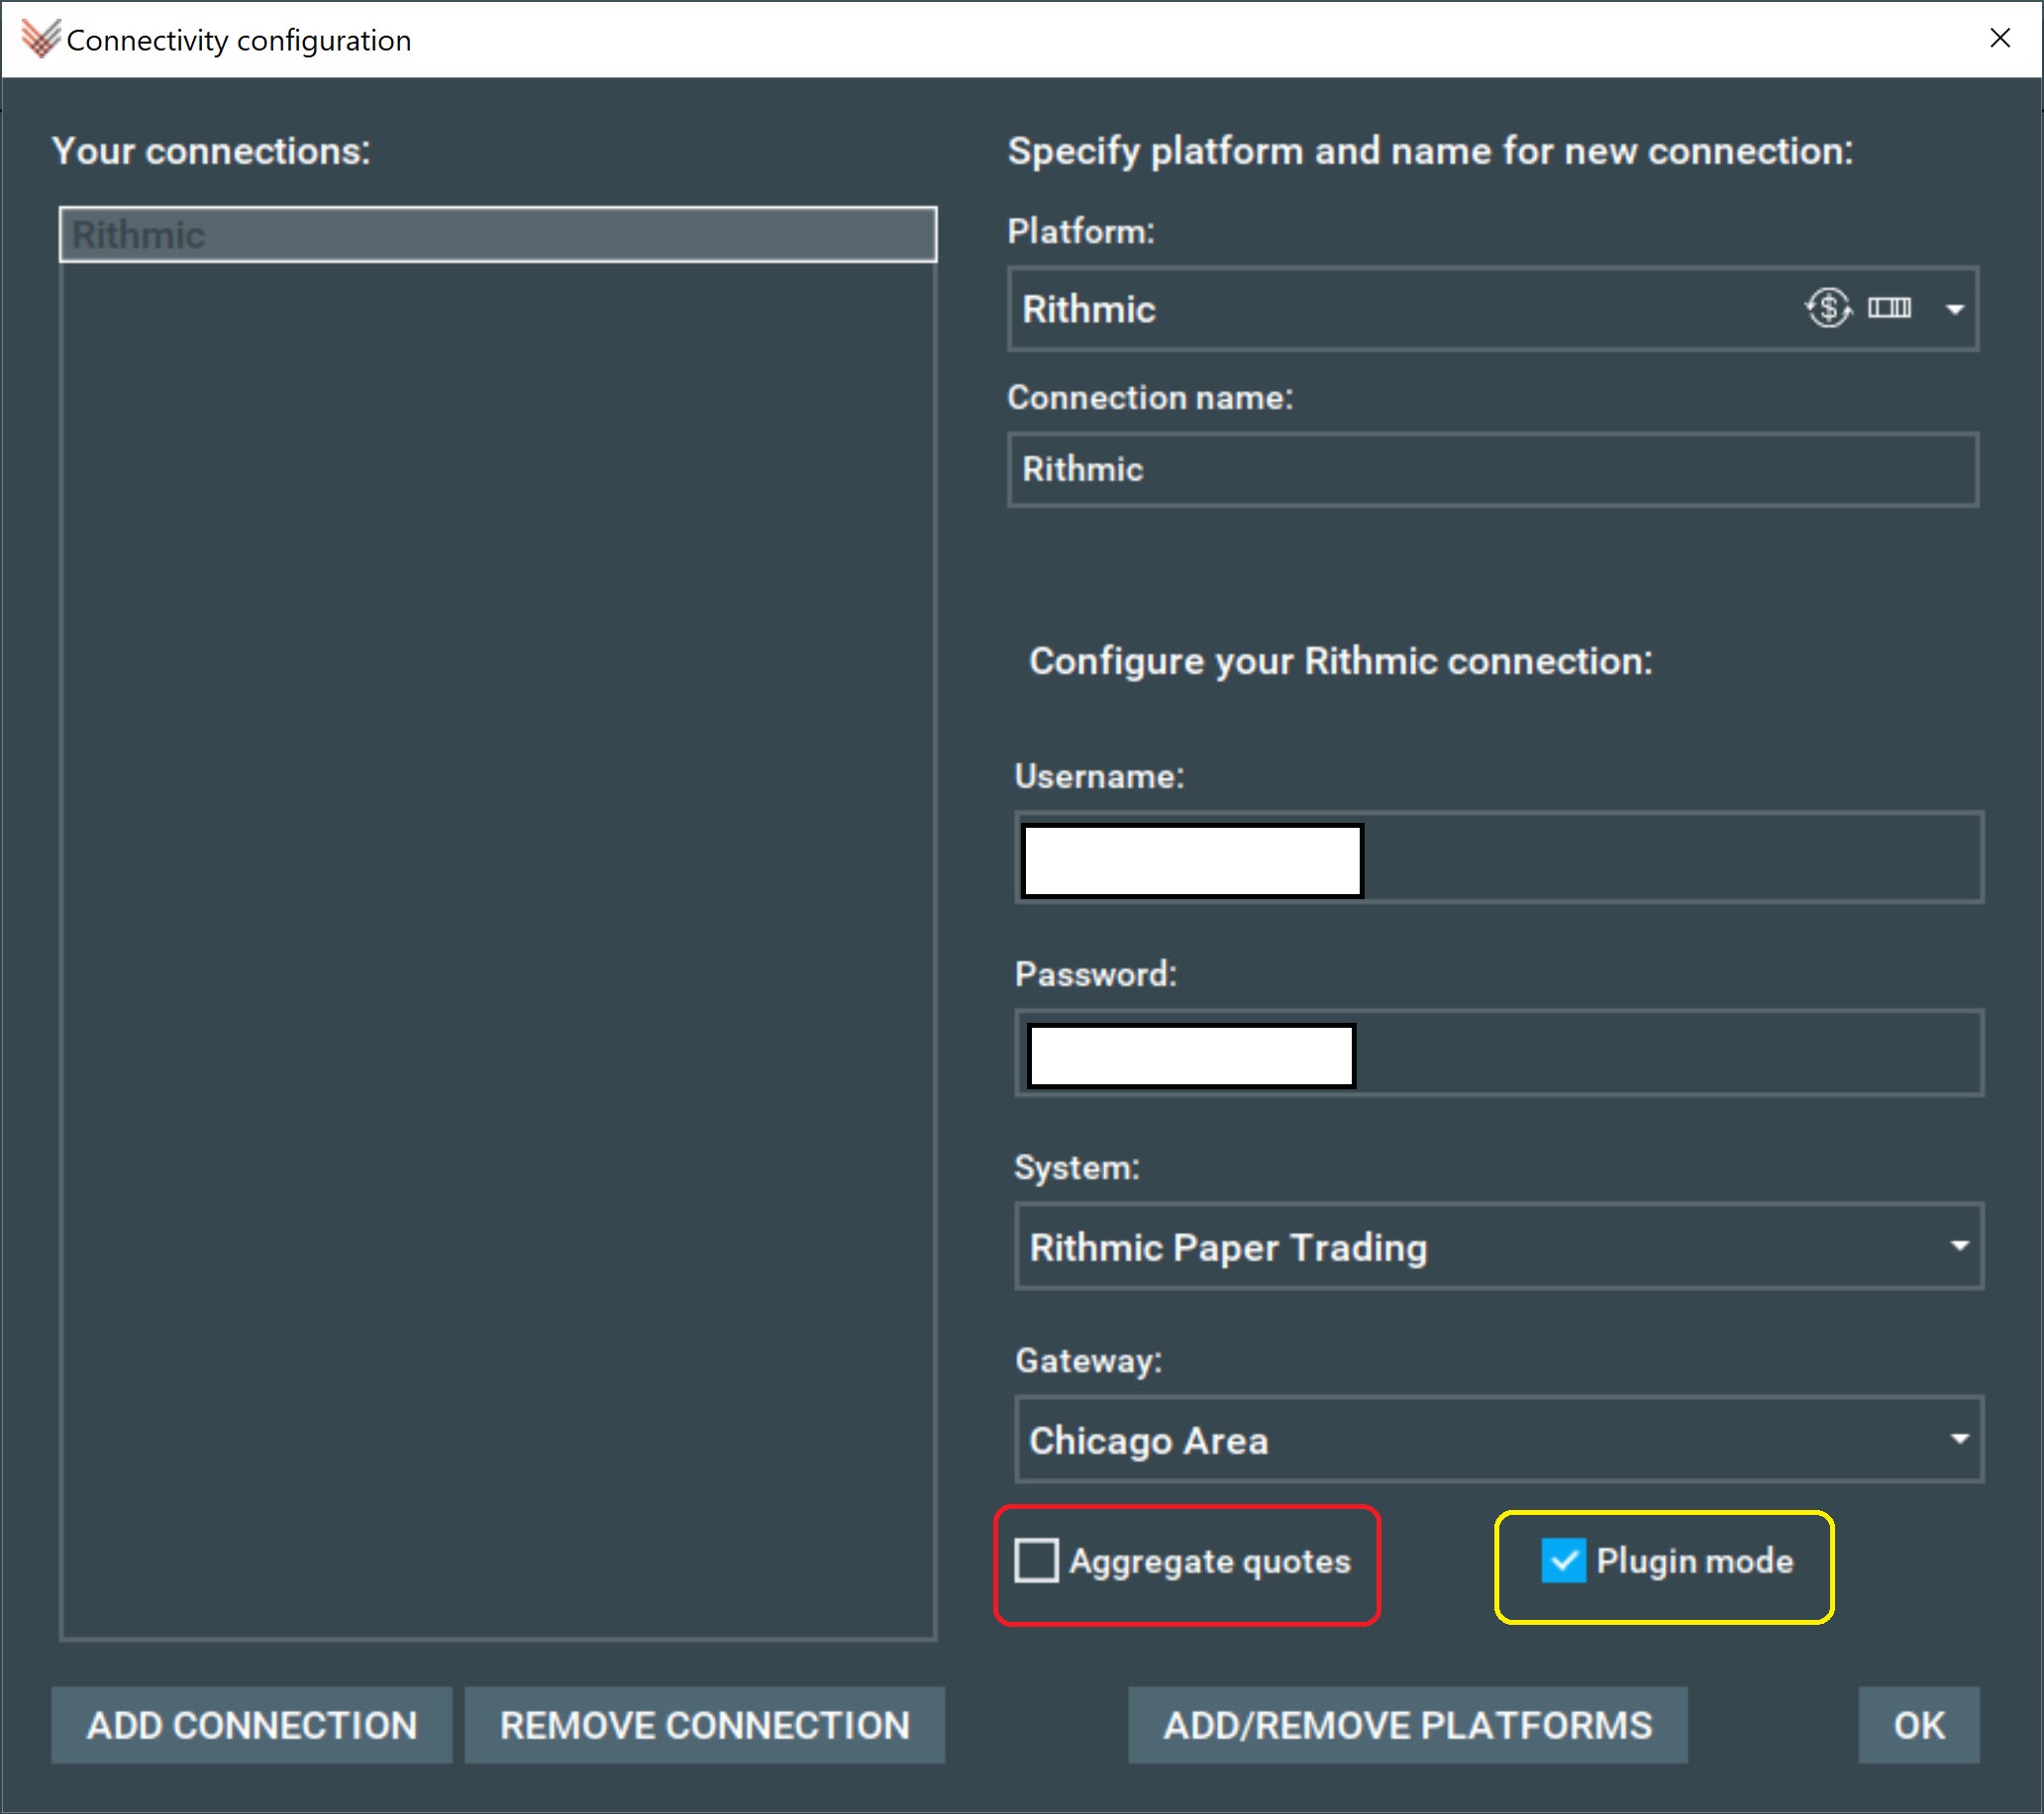
- As shown above, you must choose the Rithmic platform, and enter your username and password.
- Select a system and a gateway for your connection.
- Ensure that the “Aggregate quotes” checkbox is unchecked, while the “Plugin mode” checkbox is ticked.
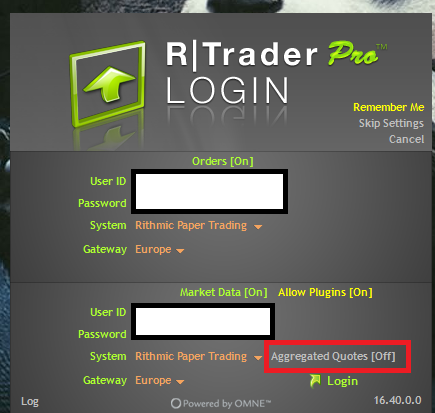
- On your Rithmic trader login page, simply enter your details and ensure Aggregated Quotes are off.
Impact of data connections on Stops & Icebergs detection
Stops & Icebergs detection relies on the microstructure of the market data you receive, and this can vary depending on the connection you're using. Even with the same instrument, data providers like Rithmic, Bookmap Data, and DxFeed may transmit subtle differences in microstructural elements, such as the sequence of trades, depth updates, or the time intervals between events. While these differences generally have no impact on the overall volume or most add-ons in Bookmap, they can significantly influence sensitive tools like the Stops & Icebergs add-on. As a result, you may observe variations in the detection of Stops & Icebergs when using different data connections.
Data Aggregation
The latest version of Bookmap includes some performance optimizations.
When the application is under heavy load and new events happen faster than Bookmap can process, an aggregation mechanism automatically turns on.
In this mode, Bookmap aggregates several individual events into one, improving performance at the cost of losing some accuracy.
This allows Bookmap to operate faster, avoiding freezes and delays in data processing, however it may affect indicators that rely on data microstructure accuracy. SI On-Chart and SI Sub-Chart are examples of those indicators.
When the automatic aggregation mechanism turns on, SI indicators may become unpredictable (lose detections, show fake detections, etc.)
Therefore, if you are using SI indicators and need accurate data, you can disable automatic aggregation to ensure you get reliable data.
Although disabling this automatic aggregation can improve accuracy, we do not recommend doing so, as Bookmap may not run smoothly during volatile market conditions. This means you’ll be unable to perform real-time actions like closing positions or moving orders.
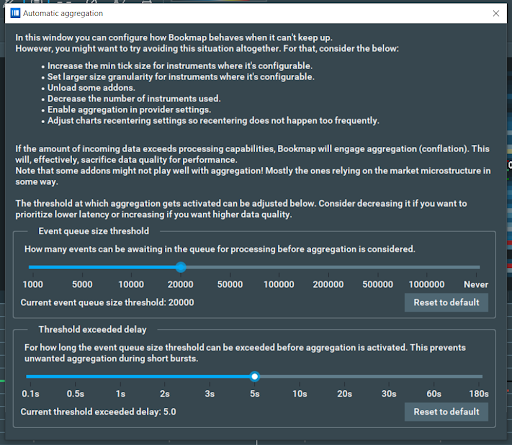
If, however, you do not need to perform real-time actions, or find the risk acceptable, to disable automatic aggregation simply go to Settings > Performance > Automatic aggregation, and set the Event queue size threshold to “Never”.
Again, DO NOT DISABLE AUTOMATIC AGGREGATION if you need to perform real-time actions and execute trades.
If you’re not trading and you’re happy to accept that Bookmap may occasionally slow down under heavy load, you can also change the default parameters to increase the SI detection accuracy. Set the events queue slider to 20000 and the delay to 5 seconds, as shown below.
When the aggregation mechanism is enabled for the first time during a Bookmap session, the SI On-Chart add-on will display the following warning:

The aggregation mechanism will also mark all places where aggregation happened (while the add-on was active) with a thin vertical line:
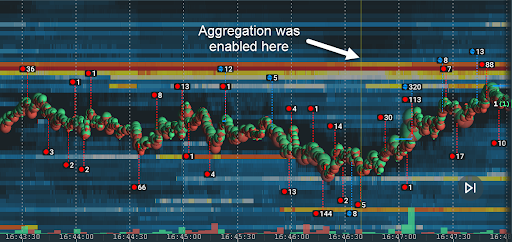
You can configure the aggregation lines in the aggregation line settings panel of the indicator:
Note: With aggregation enabled, the SI On-Chart add-on is still operational, but it cannot get the required information from parts of the data which were aggregated, so some detections may be missing.
Missing MBO data
Sometimes the MBO data feed may disconnect for varying reasons - for example a bad internet connection, or a problem with the data provider. In this case, the add-on will warn you with the following notification:
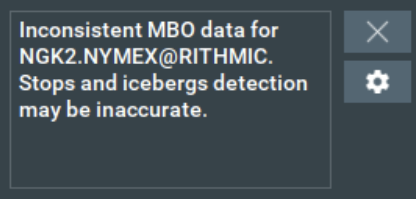
The add-on will continue to work as usual as soon as the MBO connection is restored.
Note: CME does not provide MBO data for implied orders. Read more about implied orders here.
Stops & Icebergs On-Chart Indicator FAQ
Does it include the CVD sub-chart line?
The SI Sub-chart is part of the bundle, however there is a separate add-on for the CVD indication on the bottom chart. Stops & Icebergs On-Chart is only the individual stops and icebergs visualization on the main chart.
Why do I see different Stops & Icebergs values between different PCs?
There are multiple reasons why users may see varying values between different PCs:
- Data Aggregation: This is the primary performance optimization feature. It allows Bookmap to operate faster and avoid freezes and delays in data processing, but may affect indicators that rely on data microstructure accuracy. SI On-Chart and SI Sub-Chart are examples of those indicators. Read more here. Aggregation can be applied differently on different PCs, so detection will be different too.
- Resets: There is always some difference between event timestamps on different PCs, +/- 20ms. It's enough to result in having different detections, where on one PC a reset may be applied before a reset on another.
- Different Stops & Icebergs add-on versions - We improved the SI On-Chart and SI Sub-Chart multiple times, often improving the detection accuracy and the add-on performance with each update. If the computers are running different versions, the detections may be different because of this.
Why do I see different values between my SI On-Chart and SI Sub-Chart?
First, make sure you use the latest version of both the SI On-Chart and SI Sub-Chart.
Also, note that the volume calculation logic is different in Sub-Chart and On-Chart Icebergs Indicators. For a more reliable comparison, configure indicators in the following way:
- Disable filtering for the SI Sub-Chart and set the ‘Accumulate as’ parameter to SUM.
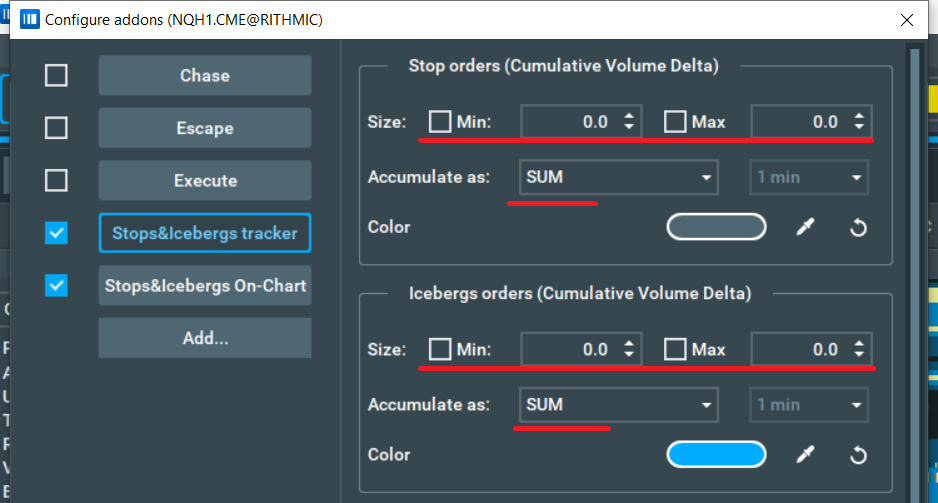
- Set the threshold for the SI On-Chart to 0, and select individual icebergs events only.
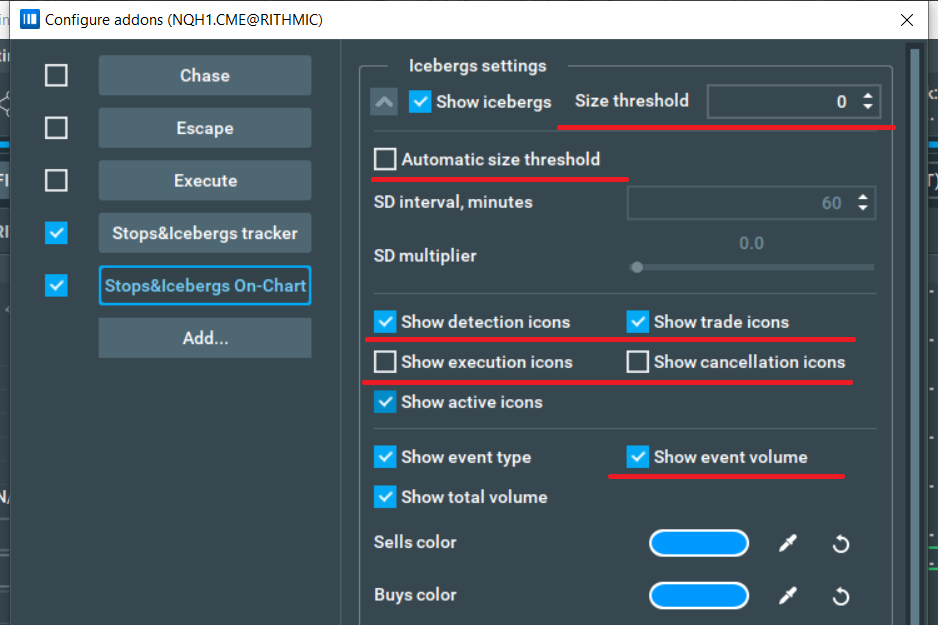
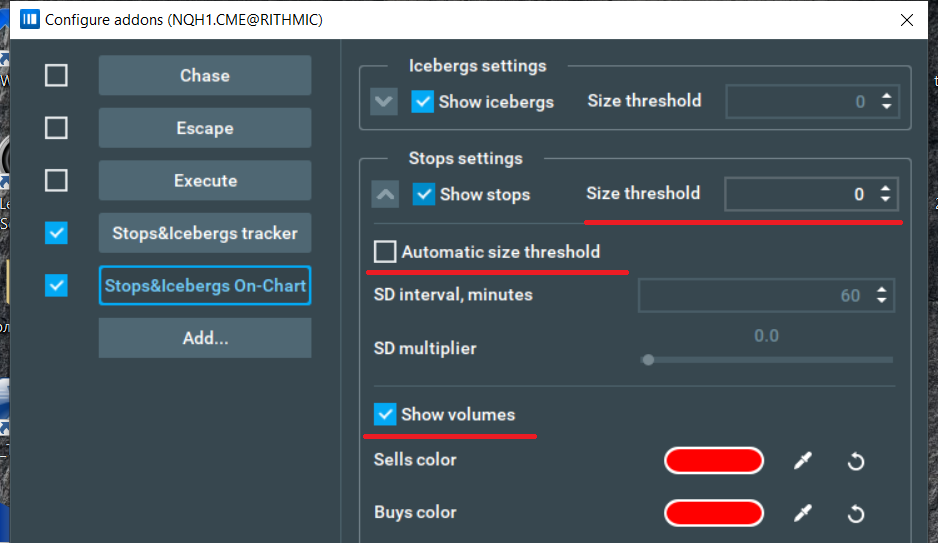
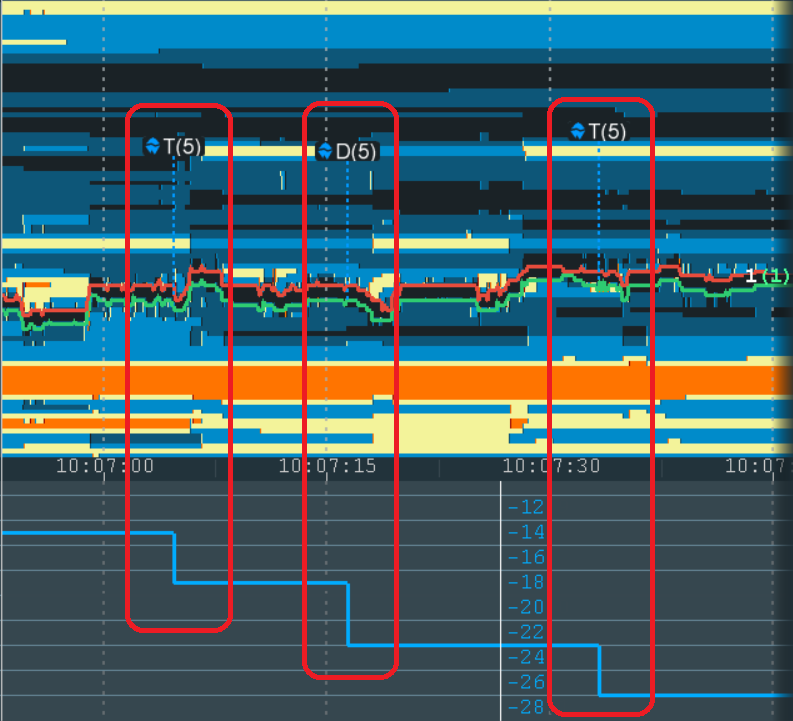
- Now it is time to zoom in and compare the volumes. Note that the engine works differently for each indicator, and the SI Sub-Chart does not include some detection events.
Why doesn’t it include the CVD sub-chart line? I liked being able to read the context of the history.
You should use the Stops & Icebergs Sub-Chart Indicator for the CVD indication on the bottom chart. SI On-Chart Indicator only visualizes Icebergs and stops on the main chart.
Why don't I see any icebergs on a specific instrument on CME?
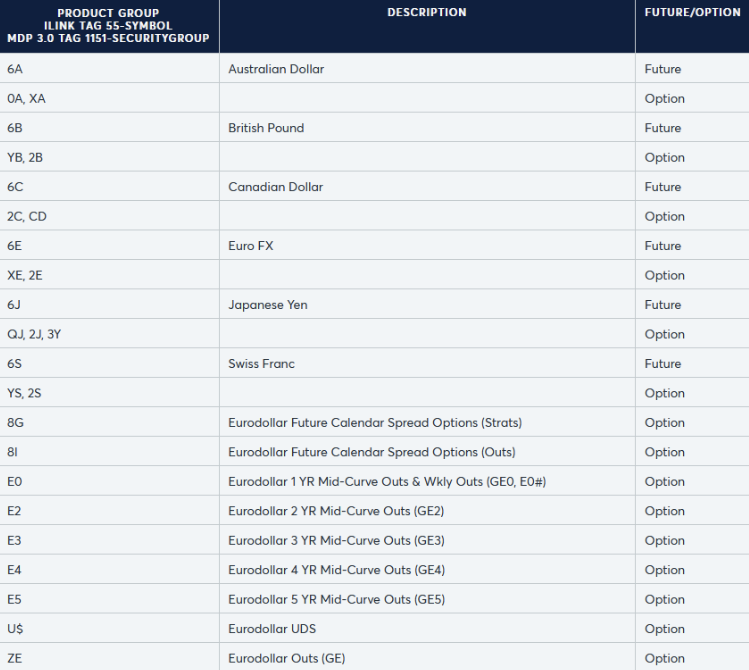
CME does not allow the use of native iceberg orders on certain instruments.
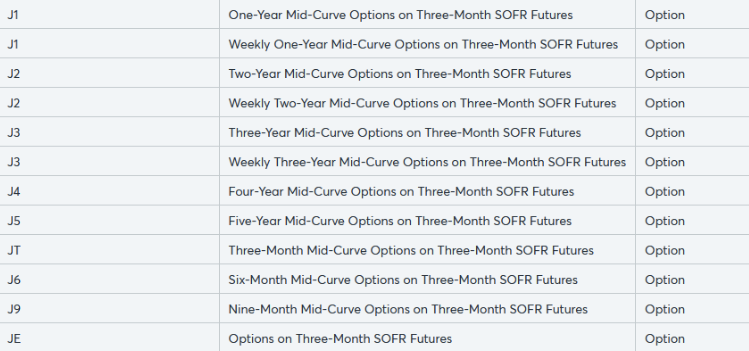
The following is a list of known CME instruments without icebergs:
Why do I get a warning message about skipped alerts?
You may see the following warning message:

If alerts are configured with a low threshold, or if the market is particularly volatile, a very large quantity of stops and icebergs may be triggered over a very short period of time. Assuming alerts are set for all or many of these, there will also be a large number of alerts, resulting in some skipped alerts as the notification system can't keep up with market activity.
To fix this you can increase the alerts threshold for less alerts. This will result in fewer notifications even during volatile markets, helping you avoid this warning and focus on larger stops and icebergs.
Note: This message is just to let you know that some alerts were skipped, and doesn't require immediate action or technical fixing.
Installation
To install the Stops & Icebergs On-Chart indicator, simply get Bookmap 7.4 and install it from the Add-ons Manager.
This add-on takes advantage of the new Add-ons Manager feature, which simplifies both the installation and updating process. If you'd like to learn more about the Add-ons Manager and how it can benefit your experience, please visit the following page.