Supporting Features
Supporting Features
Time slices
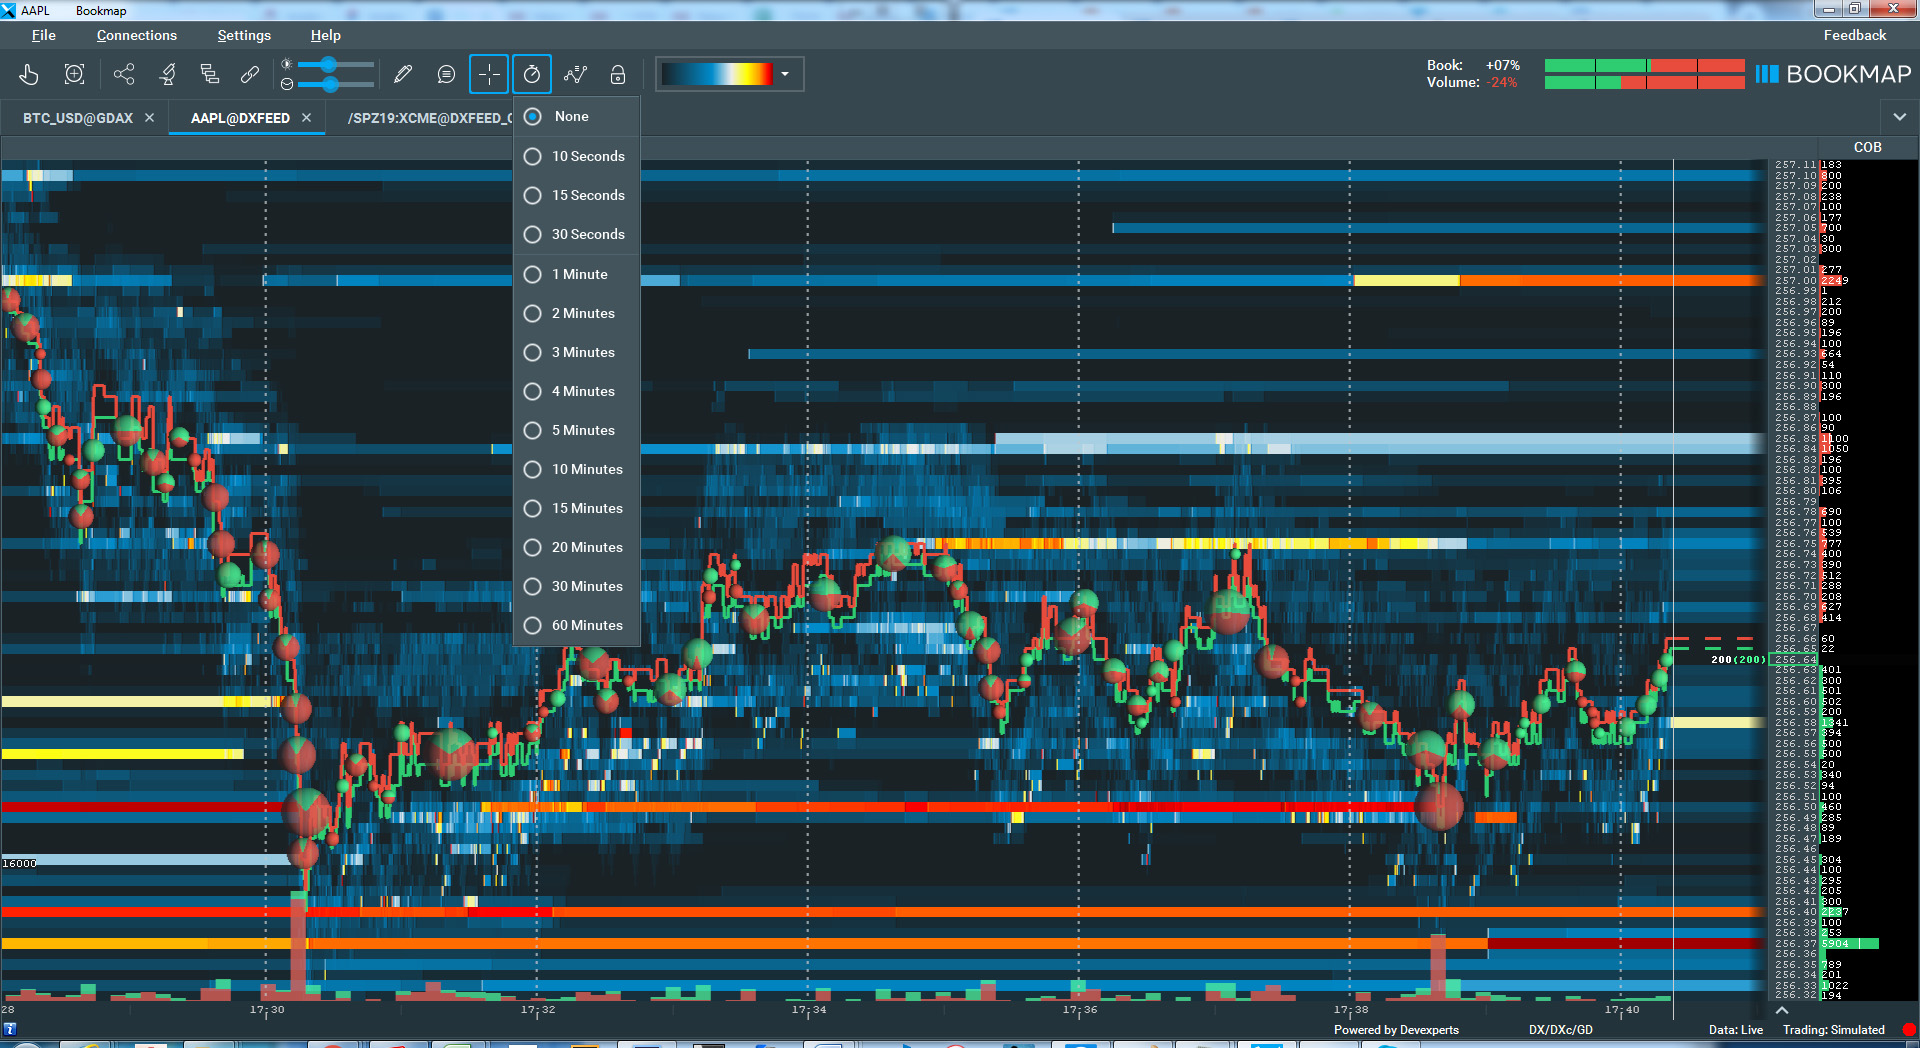
To set the chart range quickly, click the Stopwatch icon and pick the desired range. This determines the time span visible on the main chart. NOTE: this setting affects any synced charts.
The Bookmap chart displays dotted vertical lines, indicating the space between two key timestamps. The duration between these lines is based on the chart's actual time range.
Zoom in and out
This can be done in several ways:
- Use the zoom-in and zoom-out buttons on the control panel.
- Scroll using the mouse wheel over the heatmap or price axis.
- Left-click and hold while moving the mouse cursor left and right on the time axis or up and down on the price axis.
- Click the "Zoom by Drag" button on the toolbar, then select the area to focus on with green-dotted lines. Releasing the mouse zooms into the specified chart section.
- To zoom back out, press ctrl+z. See how it works in this video.
Drag Mode
- Moving the Chart: Simply left-click and drag the chart horizontally or vertically. The hand icon appears slightly pressed when drag mode is on.
- Scrolling in Drag Mode: Depending on your Bookmap subscription, you can scroll up to either 1 hour or 24 hours. Use left-click and drag left and right, or employ arrow keys for one-pixel movement. For a ten-pixel jump, hold the shift key while using the arrow keys.
- Zooming in Drag Mode:
- When zooming in using the scrolling wheel, Bookmap will keep the chart centered on the cursor location.
- Traders can also use the zoom in and out icons while in drag mode. In this case, Bookmap will keep the presentation anchored to the middle point of the current chart view.
Remember, drag mode provides a detailed view of the historical order book, letting traders explore with precision.
Vertical Re-centring
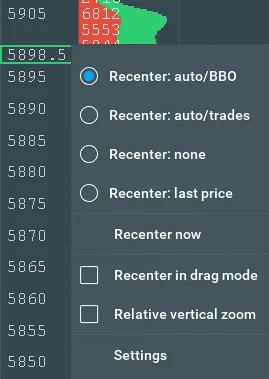
Bookmap provides auto-adjustment of the chart on the vertical axis to display the entire price movement. Right-click on the price ladder to select and configure your preferred setting.
Re-Centering Options
- Bookmap offers three dynamic re-centering modes, allowing you to focus the chart on Best Bid and Ask prices, Trades, or the Last Price.
- "None" Option
- Allows the chart to move vertically when dragged.
- Upon the drag mode release, the position remains unchanged.
- "Recenter in Drag Mode" Checkbox
- Enabled: Retains the selected re-centering preference during dragging.
- Disabled: Switches to the “None” setting, enabling manual vertical adjustments.
- Relative Vertical Zoom
- In auto re-centering modes, the vertical zoom level adjusts automatically based on price fluctuations when the horizontal zoom level changes.
- Additional Settings
- Click on Settings in the re-centering window to access further configuration options.
Settings Overview
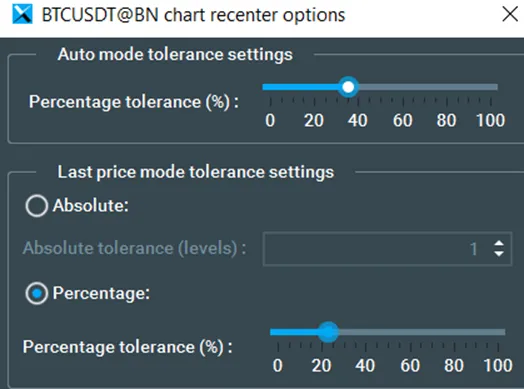
- Auto Mode Tolerance
- Applies to: Re-centering by BBO or Trades.
- Default Behavior:
- Bookmap uses an internal dynamic value to determine the distance from the visible heatmap boundaries that trigger re-centering.
- Percentage Tolerance:
- Allows users to specify a percentage deviation from the internal distance.
- Example: A 100% tolerance doubles the re-centering threshold. If the internal value is 10, the range becomes 0 to 20 (10 ± 100%).
- Last Price Mode Tolerance
- Applies to: Re-centering by Last Price.
- Percentage Tolerance: Functions similarly to Auto Mode.
- Custom Absolute Value:
- Users can define a specific absolute value for re-centering.
- The chart re-centers when the Last Price deviates from the heatmap center beyond the absolute value set by the user.
Horizontal bars
Configure the contrast of the Heatmap and the size of the Volume Dots using Horizontal bars.
Data tooltip
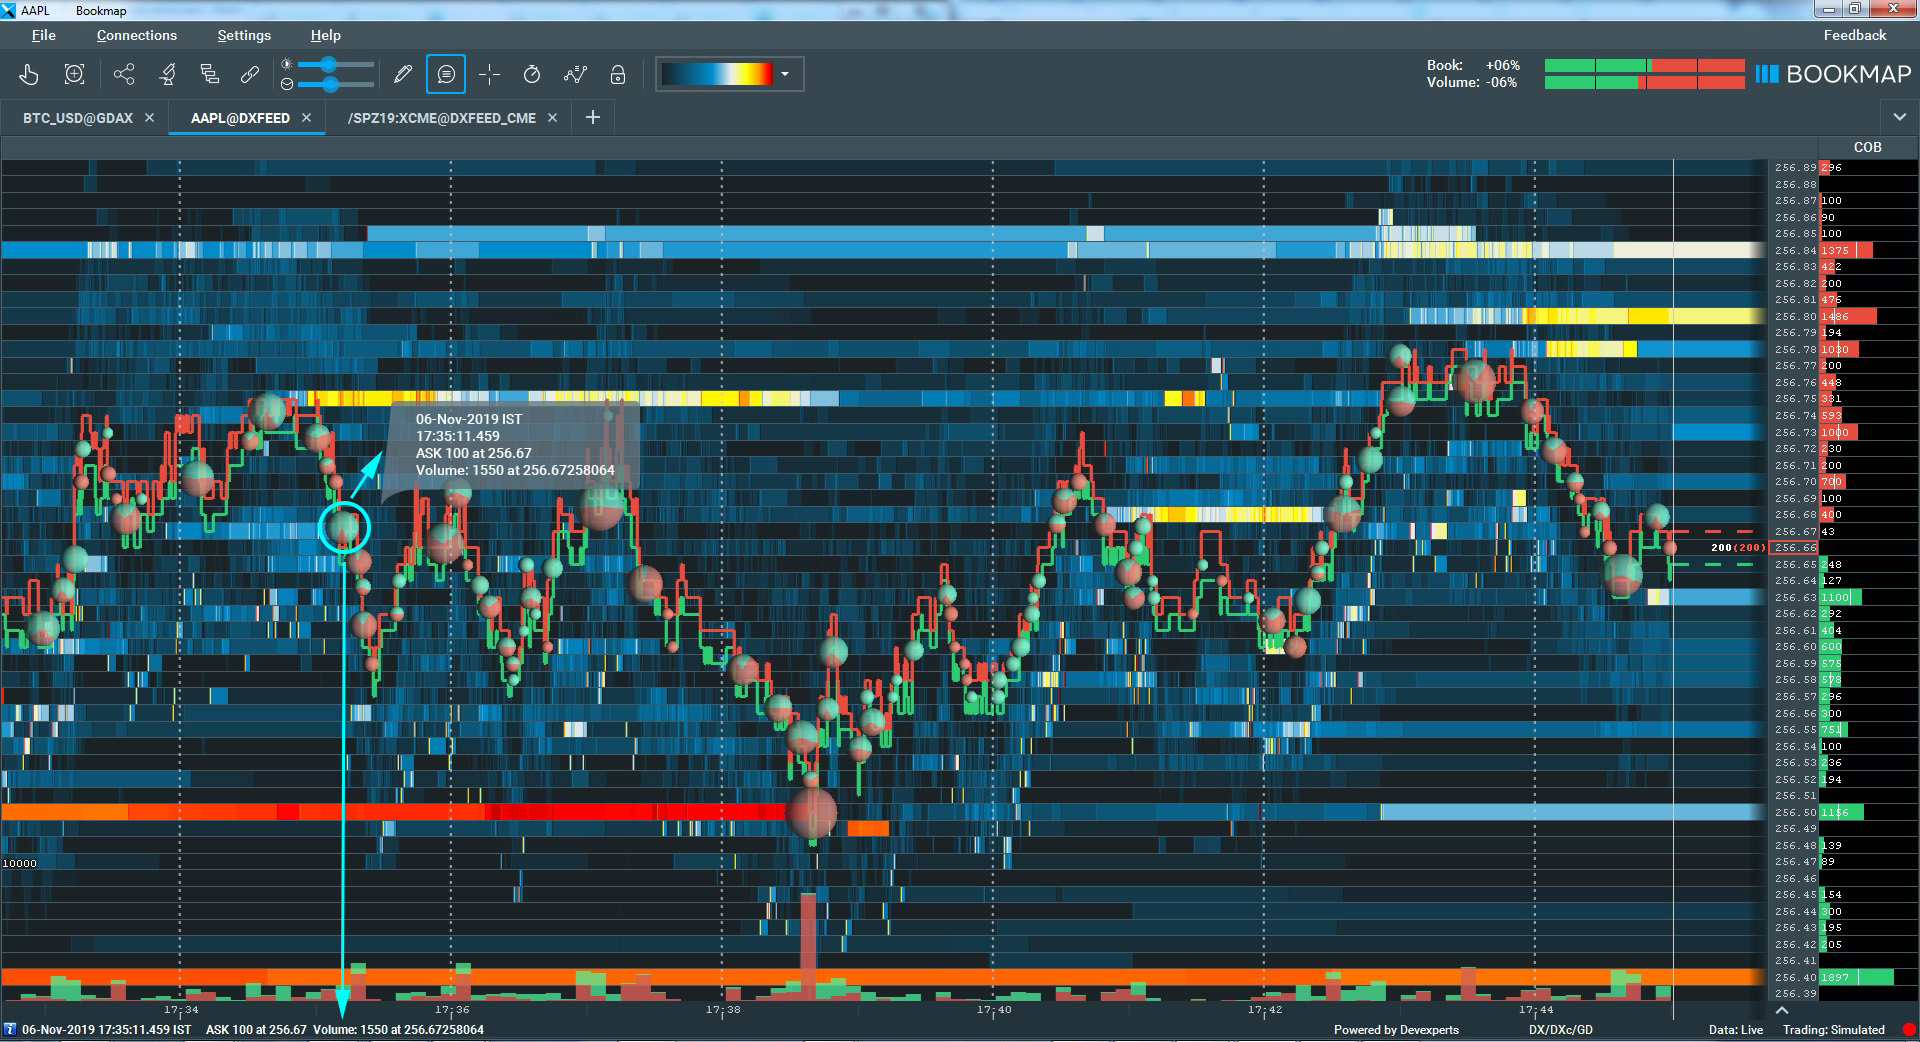
When enabled, you should see a tooltip with details of the specific data points on the main chart. These details include:
- Time, date, and timezone
- Bid or ask
- The amount and the price of the orders
- Volume traded (for volume dots only)
Crosshair
Click the Crosshair icon above the chart to switch to crosshair cursor. When enabled, you should see vertical and horizontal lines crossing at your mouse position. These lines will project on the time/price axis to create a label with a specific time / price. These labels can be enabled/disabled from Settings - Configuration - General Configuration - Show price/time labels on the chart axis. You can use this Crosshair with several instruments and quickly locate points of interest over multiple charts.
Drawing Tools
To access the drawing tools, click on the corresponding button.
In this menu, you can perform the following actions:
- Choose a figure to draw, or input text.
- Opt for ‘Single Figure Mode’ if you wish to draw a single figure and then exit drawing mode.
- Hide or show all drawings for this instrument.
- Change a drawing style.
- Clear all the drawings.
To edit or delete an element, simply right-click on it.
Hovering over certain drawings reveals labels on the time/price axis, displaying exact prices and timestamps. To enable or disable these labels, go to Settings > Configuration > General Configuration and check the box for “Show price/time labels on the chart axis”.
Snapping Drawings to 45 degrees. Starting with version 7.6, you can constrain the angle of lines, rays, and channel drawings to 45 degrees by pressing the Shift key while drawing or editing.
Events list
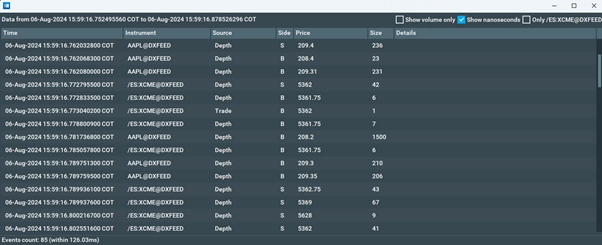
The Events List feature allows you to view all events that occurred during a selected period. The events displayed are from all the instruments to which you are subscribed.
How to Access the Events List
-
Click the corresponding button on the toolbar.
-
Left-click and drag on the chart to indicate the start and end of the period you wish to view.
Information Displayed in the Pop-up
The pop-up displays the following details for each event:
-
Timestamp: The exact time the event occurred.
-
Instrument: The financial instrument associated with the event.
-
Source: Indicates whether the event is a trade or an order placed/removed.
-
Side: Specifies whether it is a buy or sell event.
-
Price Level: The price at which the event occurred.
-
Size: For trades, it shows the trade size, and for market depth, it represents the total size of orders at this price level.
Controls and Options
The feature includes the following controls to customize the event list:
-
Show Volumes only: Exclude changes in the depth of the market.
-
Show Nanoseconds: Enable the checkbox to display timestamps with nanosecond precision.
-
Show Events Only for the Current Instrument: Filter events to show only those related to the currently selected instrument.
Voice Alerts
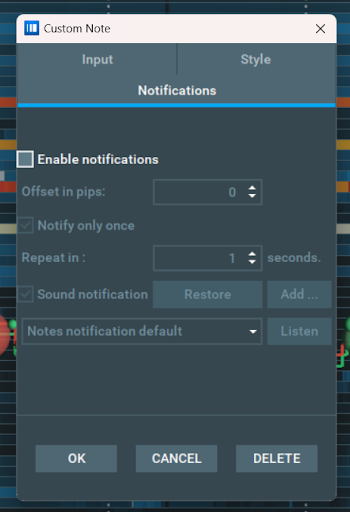
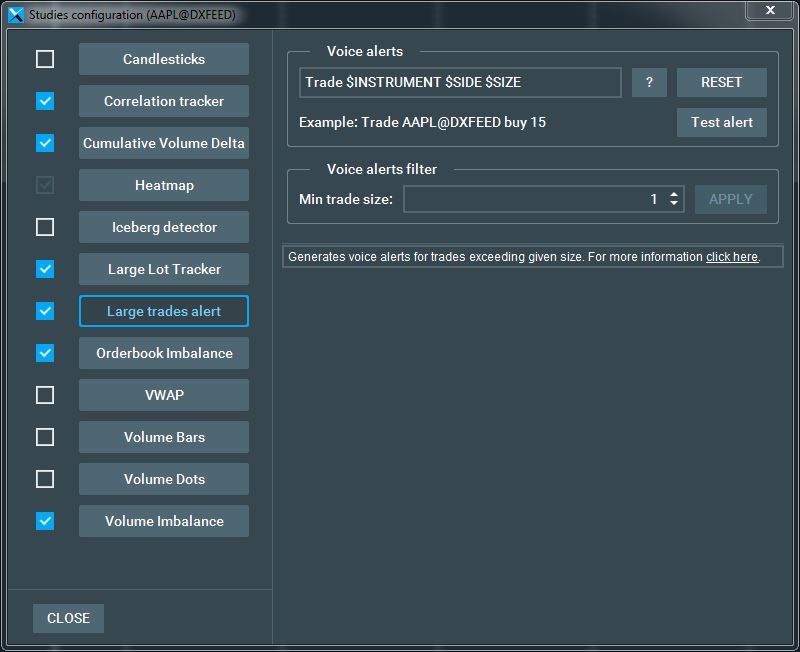
Voice alerts are provided for Order Book Imbalance, Iceberg Detector, Large Trade Alerts, and Notes. Access the first three in the studies panel by clicking the studies icon above the chart. Then, select the desired study and toggle voice alerts on the panel's right. For notes, set alerts in the notes column (Right click on the note → select Add/Edit note → Select Notifications tab → tick Enable notifications).
To manage voice alerts for trades, navigate to: Bookmap menu → Settings → Configuration → Enable sounds (on trades).
View active voice alerts via: File → Alerts.
Snapshot Generator and Social Network Sharing
By clicking the share button, you will access a menu with several sharing options for your chart. You can:
- Share it directly on Twitter or Facebook.
- Copy the link to the chart image.
- Save it directly to your computer (use Ctrl-S to quickly access this option).
Additionally, a new feature allows you to post a timestamp on the chart. To configure this, go to Settings > Configuration > General Configuration. There, you can select the position of the timestamp or choose not to display it.
NOTE: You can also use the drawing tool before taking a screenshot.
See how it works in this video.
Chart Synchronization
Application For those using multiple Bookmap charts, synchronization allows one to act as a master chart. Adjusting the range on the master will automatically update the other linked charts.
Interpretation This feature aids traders in identifying deviations in price or liquidity of correlated instruments, or in viewing various legs of spread trades.
Settings Open the charts and click the sync icon above the chart you wish to set as the master. Its range adjustments (via dragging or zooming) will be reflected on the other charts. To turn off synchronization, click the sync icon again.
Limitations
- Optimal synchronization occurs when charts are the same size.
- While one chart serves as the master, all other charts adjust to it.
- Modifying a subordinate chart's view will disrupt its sync with the master.
Data Recording
Recording setup window
Recording Setup Window: Bookmap allows you to save live session data for later analysis or training in Bookmap Replay mode. Once Bookmap is closed, the data file is ready for replay, typically stored in C:\Bookmap\Feeds. For replay instructions, refer Bookmap Replay.
For recording with Bookmap and its indicators, there's an alternative. On the Bookmap chart, click the recording icon at the bottom right, select "Start Recording", choose the recording option from the recording setup window and click start.
Order Recording
For those with the one-click trading add-on, you can record and later review your trade activities in Replay mode. To do this:
- Ensure you're recording the session by activating "Record Live Data" in the Run Options window.
- Once Bookmap is launched, select the "Record Orders Settings" option.
- After recording, close and relaunch Bookmap in Replay mode.
- Choose the desired data file for replay and ensure the "Replay Recorded Orders Settings" option is activated.
Data Refresh
Scheduled Data Refresh:
This feature lets users decide when to restart data accumulation. It can be manually or at a preset time. If recording, a refresh closes the current data file, starting a new one. To activate the Refresh feature:
- Navigate to File → Refresh Bookmap.
- Click "Now" for immediate refresh or "Schedule" for auto-timed.
- For scheduled, opt for "Alert before refresh" to get a notification before the action (allowing potential cancellation). Specify the number of seconds before the refresh to pop-up the alert.
- Click "Add refresh" and determine the timing. This can be a one-off or daily recurring event.
NOTE: Refresh won't activate if the configuration window is open.
Chart Refresh
Bookmap is optimized for advanced CPUs, ensuring fast chart rendering. Some users, however, might have systems less capable of rapid chart refreshes due to lack of advanced GPU support or low video memory. The default refresh rate for Bookmap is 40 FPS (or every 25 milliseconds).
If this causes issues on your machine, you can reduce the refresh rate. Remember, rates below 15 FPS will be visibly less smooth. To adjust the rate, navigate to Settings → Chart refresh rate on the Bookmap Control panel and select an in-range rate from the Refresh rate setting panel.
Bookmap is typically compatible with OpenGL 3 and above. If your video card doesn't support this or has outdated drivers, Bookmap can use more CPU power instead. To do this, go to Settings in the Bookmap control window and turn off the GPU acceleration option.
Presentation Mode
Designed for clear visuals during video capture or screen sharing, this mode maintains Bookmap's original frame rate. It's ideal for recording sessions with software like Camtasia or sharing screens on platforms like Skype. Activate by going to Settings → Chart refresh rate and selecting the Presentation Mode option.
