Columns
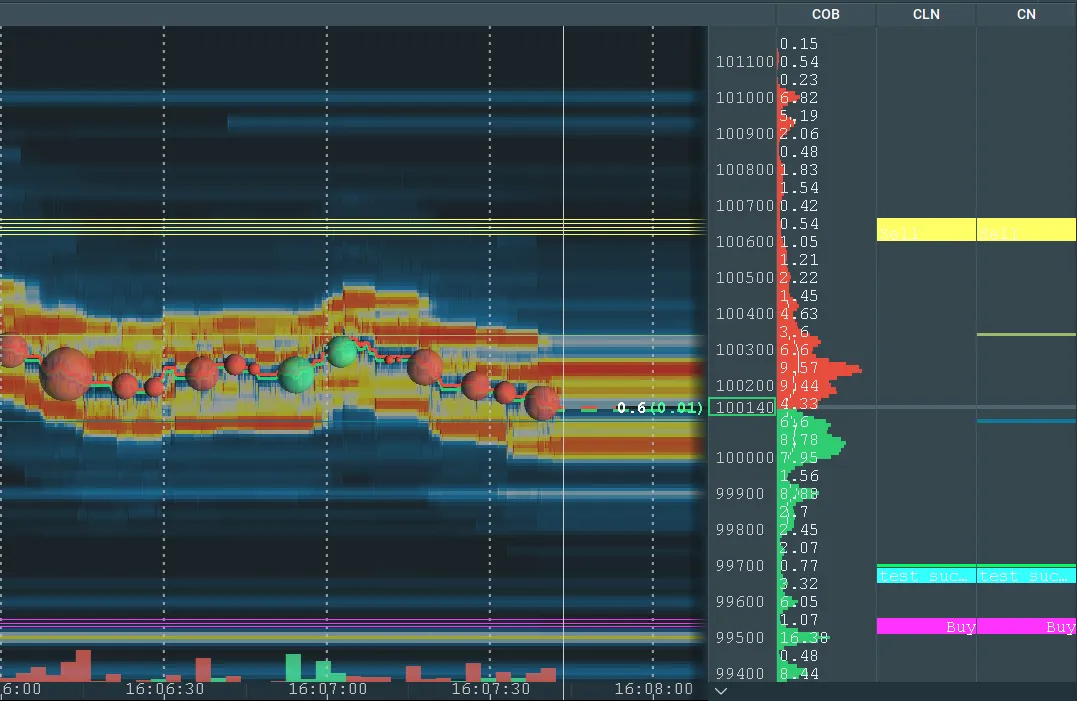
Bookmap displays configurable columns to the right of the chart, allowing users to analyze order book behavior by price. Each column can be configured to display:
- Current Order Book
- Volume
- Trades Counter
- Quotes Counter
- Quotes Delta
- Time & Sales
- Trading DOM
- Custom and Cloud Notes.
You can adjust the column arrangement by:
- Inserting or Removing via right-click
- Widening or narrowing via left-click
- Grabbing by the header and moving (left-click and hold)
To access specific column configurations, right-click the column or column header and choose the "Configure column" option.
Columns Settings
You can use column settings to choose colors for representing buyers and sellers in the volume profile, trades count, quote counts, current order book bars, and time & sale.
Users can customize the column display by:
- Displaying data as a single or split histogram
- Displaying data in bars, numbers, or both
- Changing the alignment of bars and numbers
- Inversing the data display
- Displaying only the bid side or ask side (or both)
- Displaying volume, trades, and quotes delta values
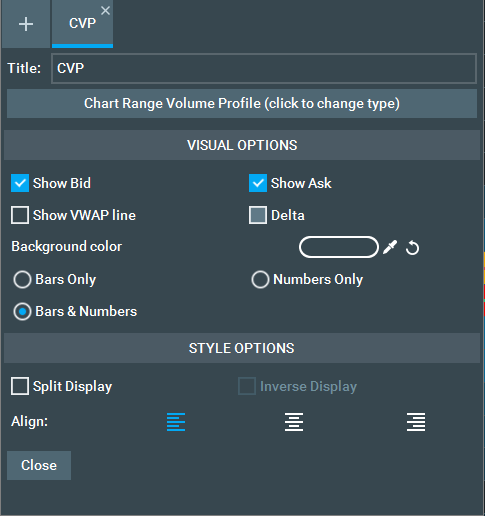
To control the column settings, right-click on the columns and select "Configure Column". This opens the configuration window where you can choose various display options.
Adding, Rearranging, and Deleting Columns
- Right-click any of the columns and select the column type to display and, where applicable, whether to use session or chart-range data accumulation.
- To rearrange the order, left-click and hold the column title, then drag the column to the desired place. Columns can be dragged to either side of the chart.
- To add or delete any column type, right-click on any column and select Insert Column or Hide Column. Initially, the column that is added is a replica of the column from which the Insert column option has been selected.
Current Order Book (COB)
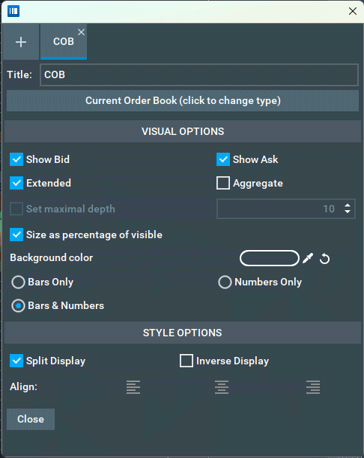
This column displays a graphical representation and numeric values of the pending orders of the current book with bars (COB). Users can interpret the size of pending orders by comparing the relative size of the graphical bars.
For the COB column, Bookmap displays a number at the top of the column that corresponds to the number of contracts represented by the full pixel width of the COB column.
Users are able to switch from numbers to percentages in configuration settings by clicking the respective checkbox, which can be applied to both views: Numbers only and Bars & Numbers.
Percentages are only related to the orders visible on the chart, the sum of percentages displayed will equal 100%, and percentages will always be shown with two digits after the decimal point, for example 10.32%, 2.14%.
It should give users a reference number to gauge the contract sizes represented by the different bars. Also, for the COB column, users can also select an aggregate display or extended display:
-
Aggregate Display: Each level represents the cumulative size of the current price level and the aggregate size of preceding levels (i.e., level 3 represents the size of Level 1+2+3), excluding Iceberg and Large Lot indications.
-
Extended Display: Choose between active or extended ranges based on the latest size updates for price levels that are out of the active range.
To control all these display options, right-click on the relevant column. At the top of the menu, click Configure column and set your display preferences from the popup.
Volume Columns
- CVP (Chart range volume profile): Volume & Chart range accumulated represent the traded volume within the visible chart range.
- SVP (Session range volume profile): Volume & Session range accumulated displays traded volume for the entire session, beginning when you subscribe to the instrument.
Both profiles represent traded volume on the price scale. By default, the number displayed represents buy and sell contracts, but you can configure them to view each separately.
And, you can interpret the balance between buyer and seller aggression by looking at the colors of the volume bars. For more details on configuring these columns, refer to this instructional video.
Trades Columns
- СTС (Chart range trades counter): Trades counter + Chart range accumulated shows the number of transactions that occurred at each price level for the visible chart range.
- STС (Session range trades counter): Trades counter + Session range accumulated displays the number of transactions that occurred at each price level since opening Bookmap and starting to collect data.
You can configure the Trades Counter for session or chart range accumulation. For additional configuration details, watch this instructional video.
Quotes Counter
- CQC (Chart range quotes counter): Quotes counter + Chart range accumulated shows the number of size updates at each specific price level, displayed by Session Accumulation. Useful for monitoring traders’ activity at a specific price level.
For configuration instructions, refer to this video.
+/- Quotes Delta
- This data represents the amount of liquidity that is either added (positive number) or pulled (negative number) from each price level.
- The red rectangle depicts liquidity added or pulled at the best ask, while the green rectangle shows liquidity added or pulled at the best bid.
- The delta resets after each update of the best bid and ask.
For configuration instructions, refer to this video.
Columns displaying volume profile, trades count, and quotes count also show a horizontal line marking the VWAP calculated from the beginning of the Bookmap session or for the chart range displayed (dependent on the view method set by the user for the specific columns).
To view the VWAP line on these columns, open the Format Column panel via the column right-click menu and enable the Show VWAP line checkbox.
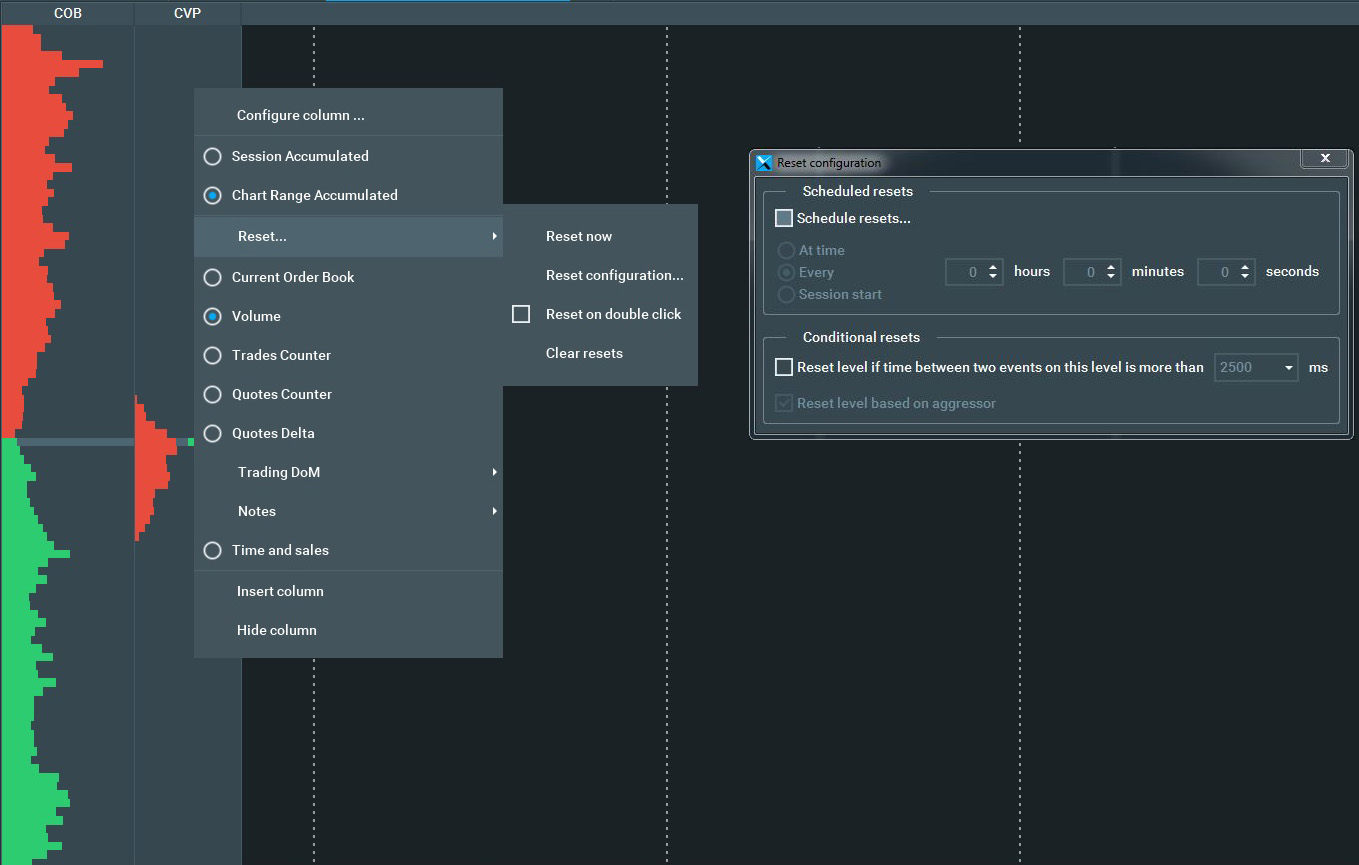
The data on the Volume, Quotes, and Trades columns can be reset in the following ways:
-
Manual reset: Right-click on the column, select the Reset menu option, and then choose "Reset Now."
-
Reset Configuration: Right-click on the column, select the Reset menu option, and then choose "Reset Configuration." This provides two options:
- Scheduled Reset at a predefined frequency and
- Conditional Reset that will reset the selected price level if the time between two trades at that level is greater than the selected period (in milliseconds).
-
Reset on Double Click: Right-click on the column, select the Reset menu, check the "Reset on Double Click" option. With this option enabled, users can reset the column by double-clicking it.
T&S (Time & Sale)
This column displays the stream of executed orders. Bookmap reconstructs the tape based on the order of data transmission: even if a single trade is broken into several executions, it is still displayed as a single trade with the total contract size. You can filter T&S to show only executions on the bid/ask or only those with a minimum or maximum contract size. The Time and Sale window is detachable. When detached, it can be returned to the column display by closing the detached Time and Sales window.
You can also export this trading log into a file. NOTE: the export range is limited to the last 10000 raw events.

Watch this video for configuration details.
Trading DOM
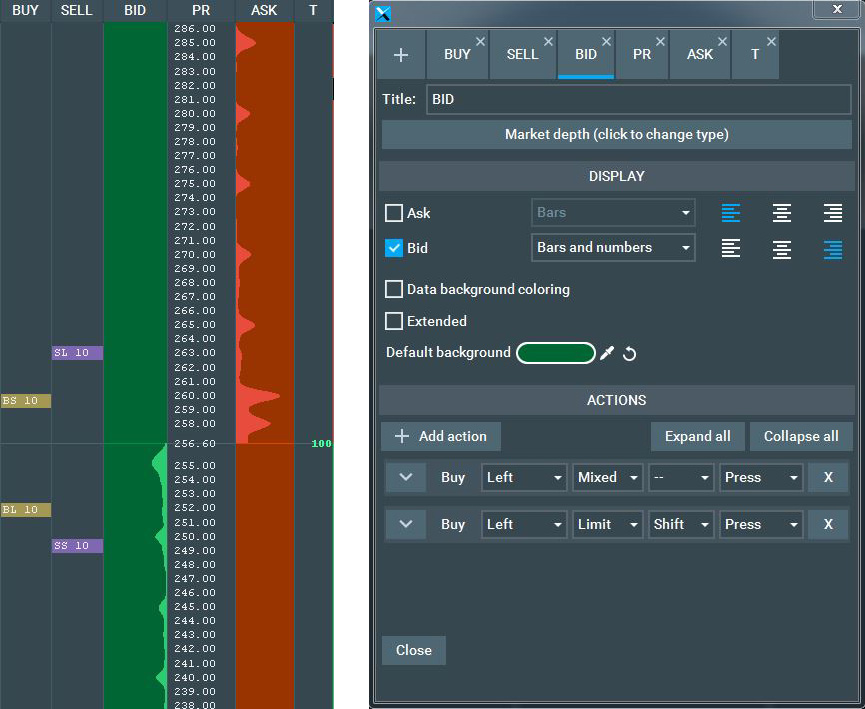
The Trading DOM column provides full DOM functionality, allowing traders to place, cancel, and modify orders with a simple left-click. Columns are modular, you can select which columns to show (working orders, place orders, and price columns), and easily adjust the columns.
Right-clicking opens a configuration panel with setup options for defining mouse commands for specific order types (limit, stop, stop limit) on the BID or ASK sub-columns, as well as order modification actions on the ORD sub-column.
Please note that the Trading DOM column and the chart do not support market orders. To execute a market order, place a buy limit order above the best bid or a sell order below the best ask.
As with any new trading function, it's advisable to practice using the DOM column in simulated trading to become familiar with its options and features.
Watch this video to learn more about how the DOM works.
Custom and Cloud Notes
Custom notes
With Custom Notes (CN), you can manually enter and style your notes or import/export them as a .csv file.
To add notes to the chart, follow these steps:
- Set the column type to "Notes > Custom Notes."
- Select the desired price level in the Custom Notes column, double-click, or right-click, and select "Add/Edit Notes."
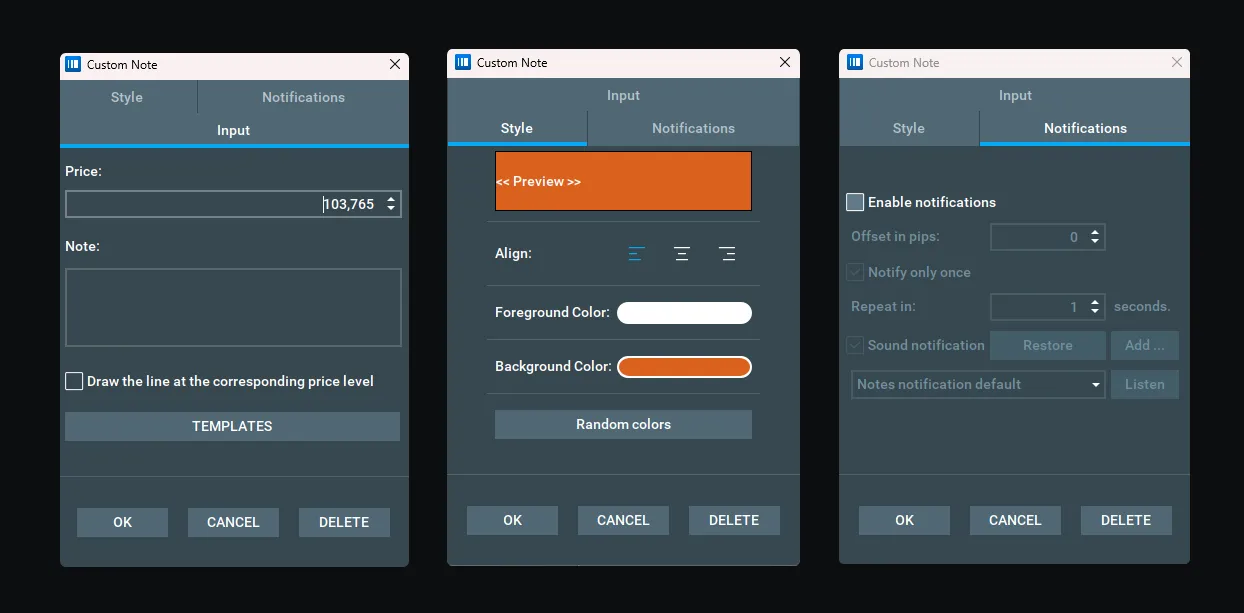
- Use the custom note dialog box to input and style your note.
- Optionally, you can add a line to the note, which will appear at the corresponding price level on the chart.
Price Alerts
Set the Price Alert in the Notification tab to get a sound notification. Configuration includes:
-
Set the offset from the price where you want the alert to trigger. Use a positive offset for a distance above the price and a negative offset for a distance below the price.
-
Check the "Notify Only Once" option if you want the alert to trigger only once. If this option is not checked, you can choose the interval at which the alert will be triggered continuously.
-
Choose the sound for the alert. This can be either the default system alert or any sound file you've added via the notifications tab.
Cloud Notes
Cloud Notes (CLN) column allows you to import your own notes or
notes shared by other Bookmap users from a cloud location.
To add cloud notes to the chart, follow these steps:
-
Set the column type to "Notes > Cloud Notes."
-
Review the risk disclaimer and proceed if you agree to it.
-
Insert the link to the cloud file and specify the interval for refreshing the file.

If you want to learn how to create and share your notes, please read more here.
